Propagating Uncertainties in Simulation Assessments of Rockets, Artillery and Mortars Intercept Alternatives
A presentation to the National Defense Industrial Association 16th Annual Systems Engineering Conference, October 2013.Abstract
Simulations that support acquisition decisions are not free from error and uncertainty. Using an example from rockets, artillery and mortar (RAM) intercept development, this presentation applies sampling-based techniques from uncertainty analysis to assess simulation analysis errors within the broad context of decisions with risk. The presentation advocates a comprehensive inventory of sources of error, an expansion of uncertainty variables using designs of experiments, and results presentations using interactive probability distributions of uncertainties.Errors in simulation-based analysis are not limited to Monte Carlo sampling errors. Simulations can have thousands of inputs and simulation-based studies depend on numerous assumptions. Current practice in modeling and simulation is to document fixed-value assumptions, to reach assumptions by consensus of authorities and experts and to perform extensive sensitivity analyses of uncertainty variables. Sensitivity analysis recognizes uncertainties in the problem, but inundates stakeholders with data without an integrating framework that supports decision making. Efficient designs of experiments enable enlarged sets of uncertainty variables compared to full factorial designs, but response surface and interpolating methods introduce additional estimation errors, which partially offset their benefits.
Uncertainties in the RAM defense problem include types of contingencies, threat capabilities, type and volume of threat attacks, types of forces that could be protected and weather and terrain that could be encountered. Any acquisition decision has the risk that the chosen alternative will not to be adequate for the scenarios that actually emerge and also the risk that the “stressing scenario” never occurs so that consumed resources might have been used to pursue other capabilities. The presentation will illustrate the need to balance these types of risk in a notional analysis of alternatives (AoA) that compares a mature RAM intercept alternative with a developmental alternative.
The presentation will briefly refer to the prior work in uncertainty analysis. Sampling-based uncertainty propagation has already been applied successfully in cost and schedule risk modeling, infrastructure protection, environmental policy, pharmaceutical portfolio analysis and in energy exploration and production. The essential principles are that distributions, not expected values, of consequences are required to support decisions with risk, and that the current state of knowledge can be represented by subjective probabilities. Monte Carlo sampling against probability distributions over the uncertain variables leads to distributions rather than expected values of measures of effectiveness (MoE).
Application of risk principles to RAM intercept solutions requires overarching MoEs that portray long-run consequences, a set of control variables describing the alternatives, a comprehensive set of uncertainty variables and probability distributions on the uncertainty variables. The presentation will show how this might be pursued using example designs of experiments and analysis of outputs from EADSIM, a U.S. Army air and missile defense engagement simulation. The example will be used to illustrate ways of integrating and presenting measures of effectiveness as distributions rather than expected values.
Risk decision methodology acknowledges that stakeholders have different and changing preferences and attitudes towards risk. The use of meta-models enables fast-running response estimates, which allow the distributions of MoEs to be instantly updated. It provides a separation of sensitivity analysis from the uncertainty analysis and a way to trace how the distributions depend on subjective probabilities and sensitivities.
|
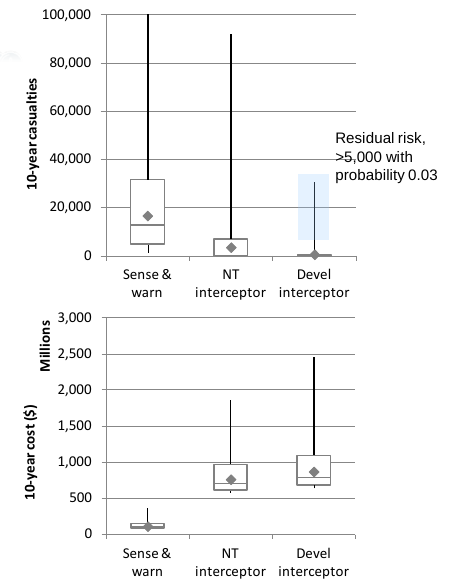
The graphic at the left highlights the use of a "box and whisker" plot as one way of presenting the distribution
of a measure of effectiveness rather than only a measure of its central tendency. A conventional analysis of alternatives
would have shown an expected effectiveness against expected life-cycle cost for each alternative. In this example, there are
three alternatives. This graphic shows measures of central tendency and extreme values. I claim that this graphic better displays
uncertainty and risk than conventional reporting, because this graphic maintains the separation of probability and
consequence that is necessary for evaluating risk. The diamond-shaped markers show the means of the samples. The "boxes" mark the central 75% of samples. The lines where the boxes join are the medians of the samples. The "whiskers", the lines extending above and below the boxes, show the extreme values of the samples. |
|
Read more about the research in the handout.